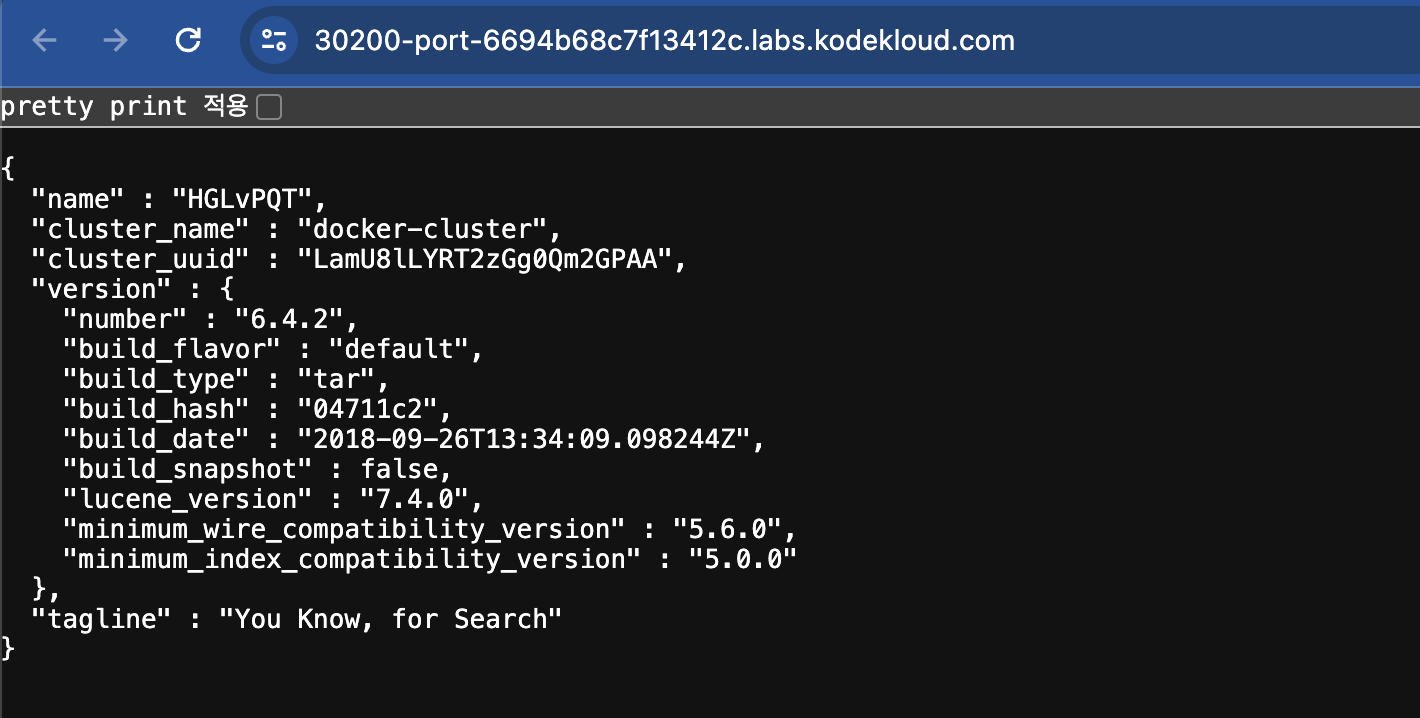
1. Identify the number of containers created in the red pod.
controlplane ~ ➜  k get pods
NAME        READY   STATUS              RESTARTS   AGE
app         0/1     ContainerCreating   0          32s
fluent-ui   0/1     ContainerCreating   0          32s
red         0/3     ContainerCreating   0          20s
answer : 3
2. Identify the name of the containers running in the blue pod.
controlplane ~ ➜  k describe pod blue
Name:             blue
Namespace:        default
Priority:         0
Service Account:  default
Node:             controlplane/192.30.28.9
Start Time:       Fri, 05 Jul 2024 14:36:59 +0000
Labels:           <none>
Annotations:      <none>
Status:           Pending
IP:
IPs:              <none>
Containers:
  teal:
    Container ID:
    Image:         busybox
...
  navy:
    Container ID:
    Image:         busybox
...
answer : teal & navy
3. Create a multi-container pod with 2 containers.
Use the spec given below:
If the pod goes into the crashloopbackoff then add the command sleep 1000 in the lemon container.
apiVersion: v1
kind: Pod
metadata:
  creationTimestamp: null
  labels:
    run: yellow
  name: yellow
spec:
  containers:
  - image: busybox
    name: lemon
    command:
      - "sleep"
      - "1000"
    resources: {}
  - image: redis
    name: gold
    resources: {}
  dnsPolicy: ClusterFirst
  restartPolicy: Always
status: {}
4. We have deployed an application logging stack in the elastic-stack namespace. Inspect it.
Before proceeding with the next set of questions, please wait for all the pods in the elastic-stack namespace to be ready. This can take a few minutes.


5. Once the pod is in a ready state, inspect the Kibana UI using the link above your terminal. There shouldn't be any logs for now.
We will configure a sidecar container for the application to send logs to Elastic Search.
NOTE: It can take a couple of minutes for the Kibana UI to be ready after the Kibana pod is ready.
You can inspect the Kibana logs by running:
kubectl -n elastic-stack logs kibana
6. Inspect the app pod and identify the number of containers in it.
It is deployed in the elastic-stack namespace.
controlplane ~ ➜  k get pods -n elastic-stack
NAME             READY   STATUS    RESTARTS   AGE
app              1/1     Running   0          7m14s
elastic-search   1/1     Running   0          7m14s
kibana           1/1     Running   0          7m13s
answer : 1
7. The application outputs logs to the file /log/app.log. View the logs and try to identify the user having issues with Login.
Inspect the log file inside the pod.
controlplane ~ ➜  kubectl -n elastic-stack exec -it app -- cat /log/app.log | grep FAIL
[2024-07-05 14:36:44,689] WARNING in event-simulator: USER5 Failed to Login as the account is locked due to MANY FAILED ATTEMPTS.
answer : USER5
8. Edit the pod in the elastic-stack namespace to add a sidecar container to send logs to Elastic Search. Mount the log volume to the sidecar container.
Only add a new container. Do not modify anything else. Use the spec provided below.
---
apiVersion: v1
kind: Pod
metadata:
  name: app
  namespace: elastic-stack
  labels:
    name: app
spec:
  containers:
  - name: app
    image: kodekloud/event-simulator
    volumeMounts:
    - mountPath: /log
      name: log-volume

  - name: sidecar
    image: kodekloud/filebeat-configured
    volumeMounts:
    - mountPath: /var/log/event-simulator/
      name: log-volume

  volumes:
  - name: log-volume
    hostPath:
      # directory location on host
      path: /var/log/webapp
      # this field is optional
      type: DirectoryOrCreate
동작 설명
• 이 YAML 파일은 elastic-stack 네임스페이스에 app이라는 이름의 Pod를 생성합니다.
• Pod는 두 개의 컨테이너를 포함합니다:
• 1. app 컨테이너는 kodekloud/event-simulator 이미지를 사용하며, /log 경로에 log-volume 볼륨을 마운트합니다.
• 2. sidecar 컨테이너는 kodekloud/filebeat-configured 이미지를 사용하며, /var/log/event-simulator/ 경로에 동일한 log-volume 볼륨을 마운트합니다.
• 두 컨테이너는 호스트 시스템의 /var/log/webapp 디렉토리를 공유하여 로그 파일을 저장하고, DirectoryOrCreate 옵션을 통해 디렉토리가 없으면 자동으로 생성됩니다.
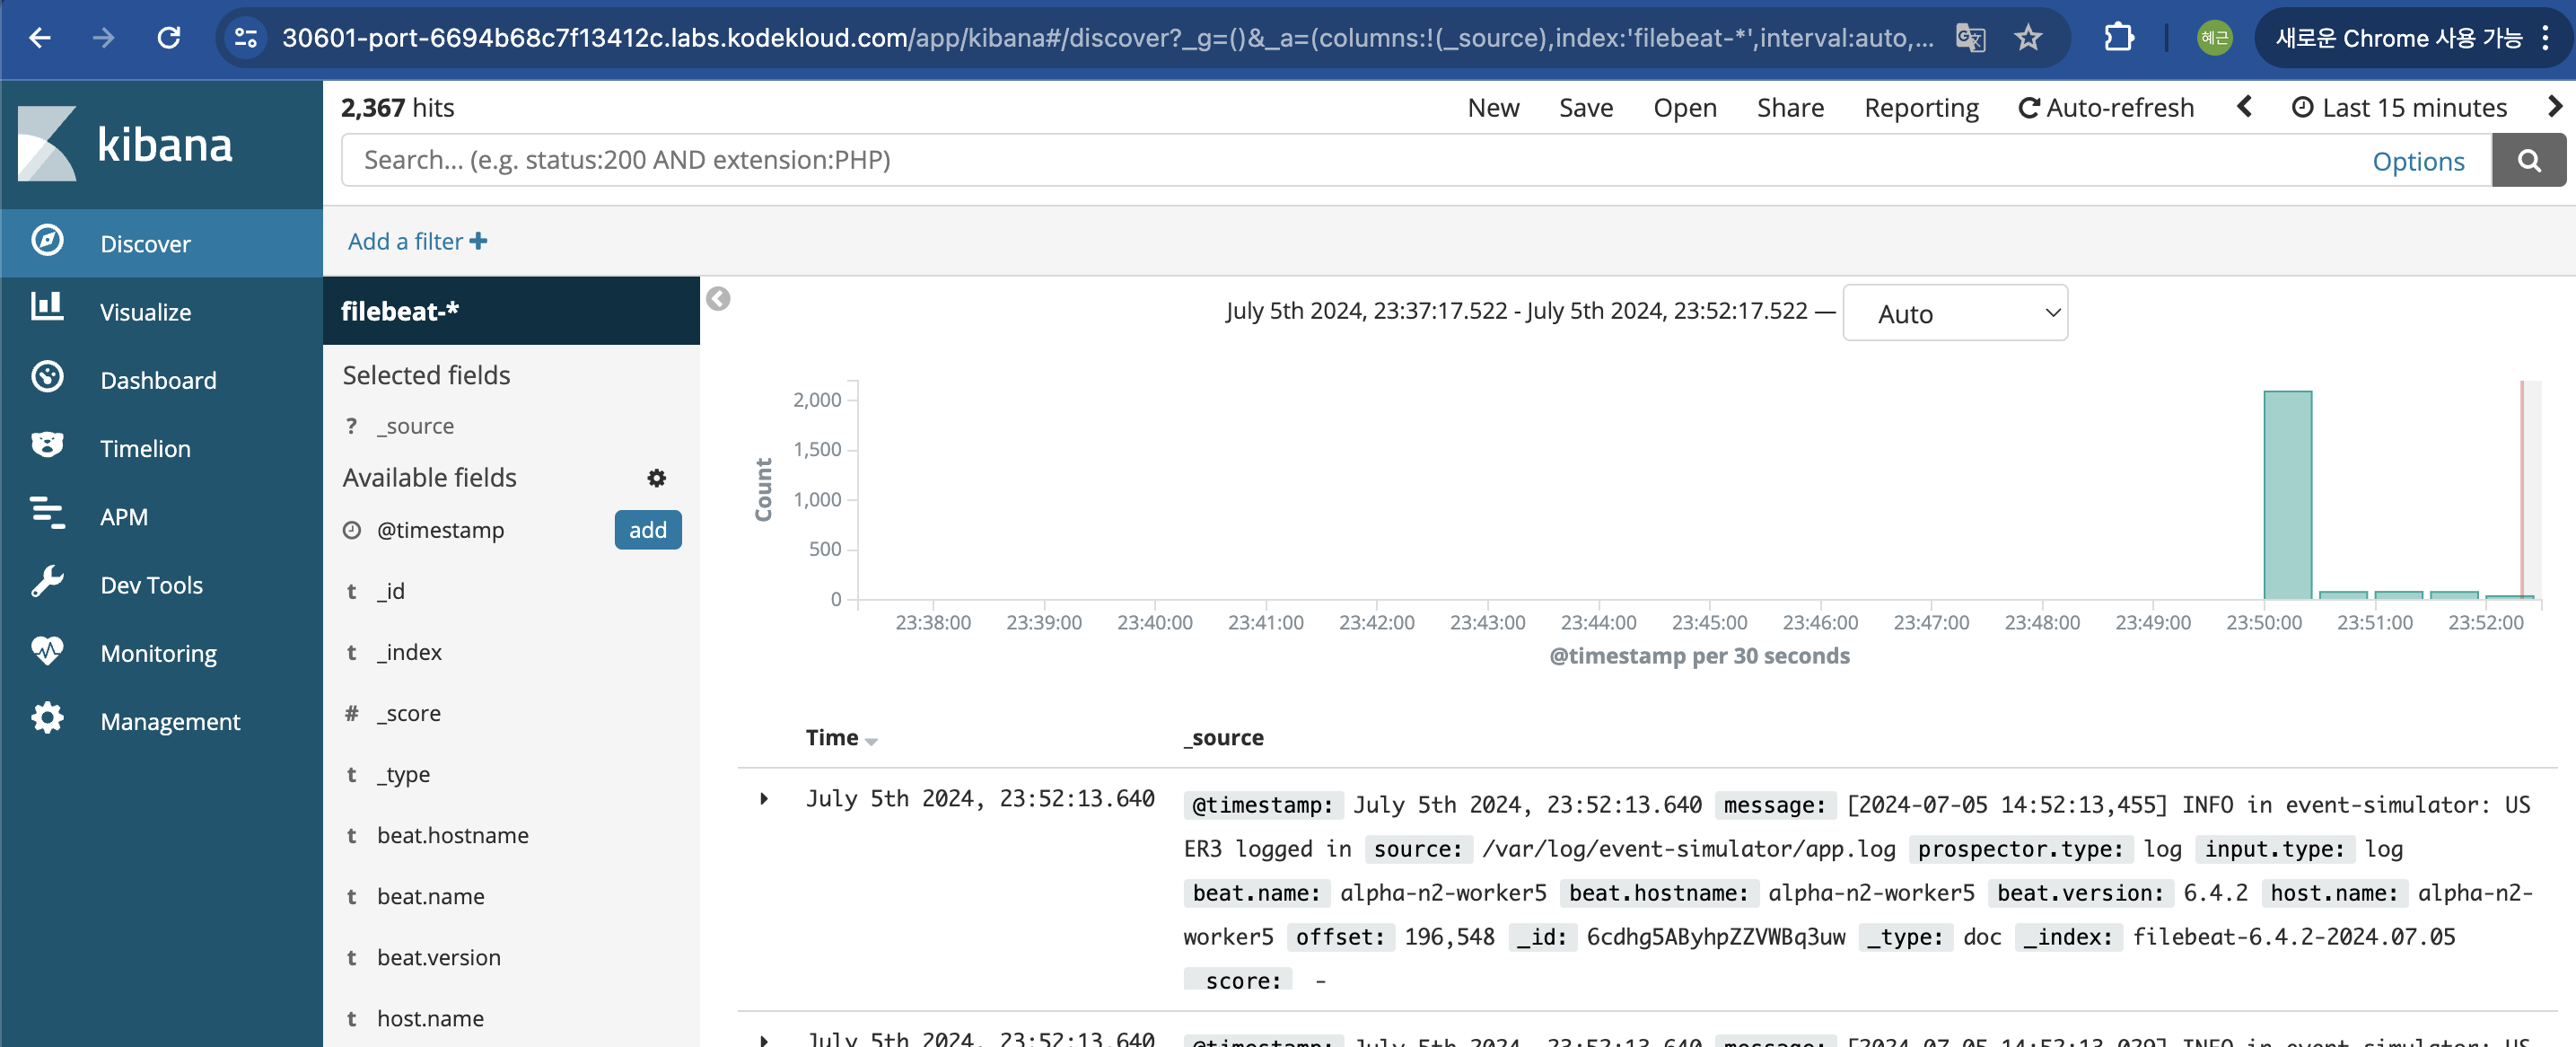
10. Inspect the Kibana UI. You should now see logs appearing in the Discover section.
You might have to wait for a couple of minutes for the logs to populate. You might have to create an index pattern to list the logs. If not sure check this video: https://bit.ly/2EXYdHf

'IT 기술 > k8s' 카테고리의 다른 글
| [cka] OS Upgrades (0) | 2024.07.10 |
|---|---|
| [cka] Init Containers (0) | 2024.07.06 |
| [cka] Secrets (0) | 2024.07.05 |
| [cka] Env Variables (0) | 2024.07.05 |
| [cka] Rolling Updates and Rollbacks (0) | 2024.07.02 |


댓글